
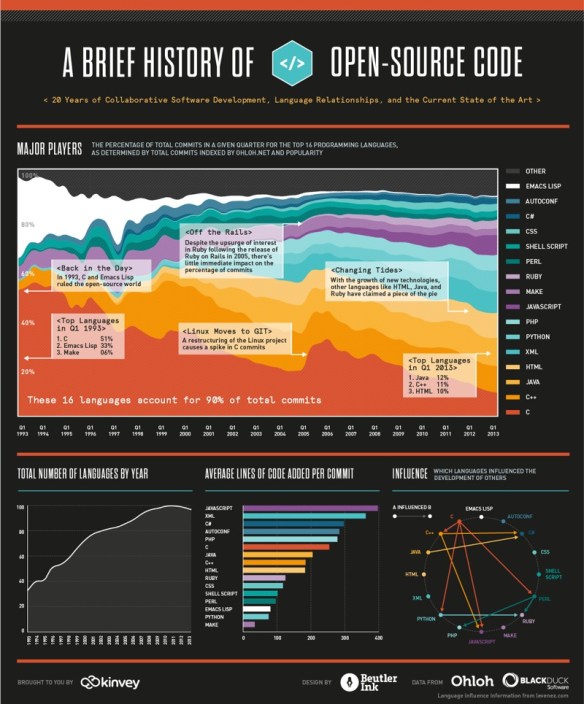
We were able to visualize the percentage of total commits in a given quarter for the top 16 programming languages from 1993 until today. We hope you’ll find this image—a provocative pattern of dips and spikes—to be as interesting as we do. It truly shows how dynamic the world of programming is. We’ve also included a few graphs on other interesting data points: total number of languages by year, average lines of code per commit, and tracking which languages influenced the development of others.
via A Visual History Of The Last 20 Years Of Open Source Code | ReadWrite.
