
SXSW: NRK’s dedicated tech team employs “open source” tactics to fight trolling. READ MORE: How a Norwegian comment section turned chaos into order—with a simple quiz | arstechnica
Tag Archives: data
Pairing Wine and Cheese with Data Science | Center for Data Innovation #dataviz #data #datascience #databases #visualization
University of Toronto computational biology professor Gary Bader has created an interactive data visualization that allows users to identify complementary wine and cheese pairings based on different factors, including a wine’s country of origin and a cheese’s moisture level. The visualization uses software called Cytoscape that Bader and other researchers initially developed for complex genetic and molecular analysis, such as mapping the relationship between different genes and autism or cancer. Users can search for approximately 1,000 ideal pairings between 100 different red and white wines and 270 cheeses. READ: Pairing Wine and Cheese with Data Sciencw | Center for Data Innovation
The Data Savvy Librarian | Christopher Erdmann | DTU | YouTube #data #lifecycle #libraryservices #research #tools #skills #training
An Ode to the Underappreciated Spreadsheet | HBR #spreadsheets #Excel #productivity #organization #metadata #data
Spreadsheets are indispensable tools to us data geeks so I always keep an eye out for new ideas and tips in managing data using spreadsheets. I use many of the features and functions listed in the article and even inspired by a few I never thought of before! In the Related links below the first link is one of the most popular posts on infophile.
Spreadsheets get a raw deal. We are so dependent on tools like Excel and Google Sheets for managing budgets and P&Ls that it’s easy to fall into the trap of seeing spreadsheets only as applications for managing money, or at the very least, for working with numbers.
But the structure and features of spreadsheets make them so useful for a wider range of purposes, from project planning to writing. Breaking information or text into cells helps you break your work into bite-size chunks so you can find different ways of structuring it. The ability to sort and filter cells makes it easy to find, categorize, or reorganize lists or content. And yes, it’s nice to be able to do quick calculations when you are working with numbers. READ MORE: An Ode to the Underappreciated Spreadsheet | HBR
Related:
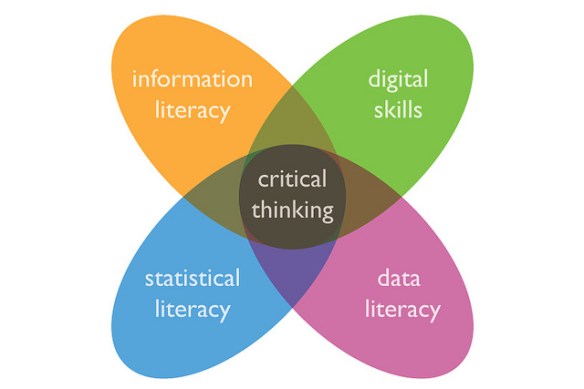
We Need a Better Way to Visualize People’s Skills | HBR #skills #data #visualization #employment #analytics #competencies
Photo Source: HBR
How can companies get a better idea of which skills employees and job candidates have? While university degrees and grades have done that job for a long time, they’ve done it imperfectly. In today’s rapidly evolving knowledge economy, badges, nanodegrees, and certificates have aimed to bridge the gap – but also leave a lot to be desired. While HR departments are eager for better “people analytics,” that concept is still fuzzy. And simply collecting data is not enough – to be used, data has to be presented usefully. READ MORE: We Need a Better Way to Visualize People’s Skills | HBR
Are Librarians becoming Data Analysts? | Linex Systems #Librarians #data #analysis #analytics #dataanalysts #analysts
Right now, one of the most discussed trends is that of data – big data, small data, data analytics, predictive data. It’s all relevant, it’s all important and it should be on all our radars. Data is constantly growing and, as it does, we are finding new ways to harness it and fulfill our potential. Within this, two significant themes emerge which we shall explore here:
- Using data to improve your current awareness service
- Your current awareness service including more data, and different types of data
Read More: Are Librarians becoming Data Analysts? | Linex Systems
My Comment: An excellent article providing an overview of some services data analysts may provide. My role as a Research Analyst includes the following data related activities: analyzing data sets to provide insights to the public and fulfill client requests; using data to tell stories; analyzing click rates to determine content relevancy; peer comparison; crafting factual statements for business development and marketing collateral and presentations; sourcing, organizing and managing data sets; and the list goes on!
The Role of Librarians in Data Science | JoEsL #datascience #librarians #LIS #research
Many academic institutions and their libraries have developed research data services, but sometimes institutional objectives, professional organizations, and librarians’ current and future roles aren’t always in sync. In this issue of the Journal of eScience Librarianship, librarians report on moving forward with various services, but frequently face institutional and professional obstacles. READ: “The Role of Librarians in Data Science” by Elaine R. Martin | Journal of eScience Librarianship
Things You Can Do as a Library Student to Prepare for a Career as a Data Librarian | hls
We do so much in library school—take classes, work, study, and figure out how to market ourselves when we graduate. In this post, I’d like to talk about how I became a data librarian, and what you can learn about data while still in library school! READ: Things You Can Do as a Library Student to Prepare for a Career as a Data Librarian | hls
Data USA from MIT Media Lab is a Stunning New Tool for Analysts, Economists and Data Geeks #data #tools #visualization #statistics #dataviz #tech

MIT Media Lab and partners Deloitte and data visualization startup Datawheel, have launched a mammoth and stunning new tool called Data USA, where users are able to mine and visualize United States Government open data. Data USA is great new tool for analysts, economists, and data geeks. Data USA has gathered data from what used to be multiple sources into a singular open data platform.
As a Research Analyst for Calgary Economic Development, managing and analyzing data is a critical component of my work. With the current economic downturn, improved data interpretation and analysis tools such as Data USA, are increasingly important. We use data from Statistics Canada and other organizations to compare economic indicators for Calgary to other cities in Canada and North America. With this analysis we can then determine how Calgary ranks competitively with other metropolitan areas. We use this insight to create strategies to promote our city, attract business and diversify our economy. Open data rocks!
#Data Artist Proves Just How Unique Shakespeare’s 154 Sonnets Really Are | HuffPost #Shakespeare #poetry #analysis #visualization #art

In data artist Nicholas Rougeux’s new series of Shakespeare sonnet signatures, each poem is summarized with its own distinctive scribble — a shorthand that may not help them with Capital One, but allows readers to quickly visualize the individuality of each poem. “No two are the same — or even similar,” Rougeux noted… READ MORE: Data Artist Proves Just How Unique Shakespeare’s 154 Sonnets Really Are | HuffPost
