
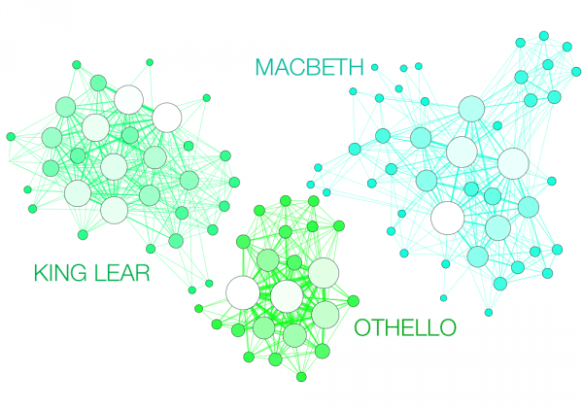
Every story has its architecture, its joints and crossbeams, ornaments and deep structure. The boundaries and scope of a story, its built environment, can determine the kind of story it is, tragedy, comedy, or otherwise. And every story also, it appears, generates a network—a web of weak and strong connections, hubs, and nodes. Take Shakespeare’s tragedies. We would expect their networks of characters to be dense, what with all those plays’ intrigues and feasts. And they are, according to digital humanities, data visualization, and network analysis scholar Martin Grandjean, who created the charts you see here: READ MORE: 11 Shakespeare Tragedies Mapped Out with Network Visualizations | Open Culture
