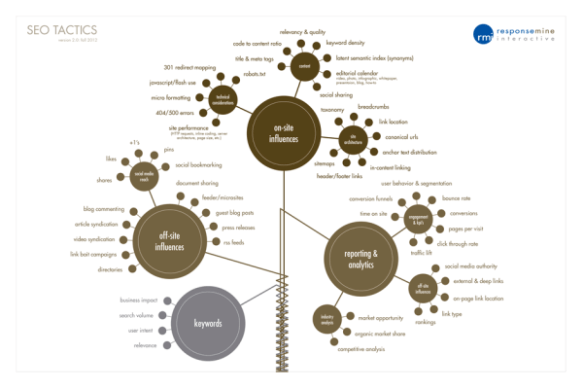
2012 SEO Tactics – Blog About Infographics and Data Visualization | Cool Infographics


The 2012 SEO Tactics infographic from Response Mine Interactive breaks down the tactics they use to get the highest rankings for their clients in 2012, and expect them to stay the same for the majority of 2013. The four main tactics are on-site influences, off-site influences, reporting & analytics, and keywords via 2012 SEO Tactics – Blog About Infographics and Data Visualization | Cool Infographics.

Informative infographic illustrating aspects of SEO.

SEO Tactics

10 Developer Tips To Build A Responsive Website [Infographic] – ReadWrite


From the article:

Many website owners say to themselves, “I want my site to look great on mobile, but I don’t know where to start.”

If you are in the business of building and designing websites, you cannot ignore the fact that many people are going to be visiting your sites on their smartphones and tablets. The Web and the mobile browsers remain one of the top ways that users interact with websites and if they have trouble on their smartphone, there is a good chance they are not coming back.

That’s where responsive design can help.

Responsive design is a concept where you build your website once and then format it so it can adapt to any screen size that accesses it. Designers use HTML5 and CSS to build the sites and set parameters so the content will resize itself whether the user is in vertical or horizontal viewing mode, on a tablet, desktop or smartphone or even a screen as large as a television.

via 10 Developer Tips To Build A Responsive Website [Infographic] – ReadWrite.

Tips Responsive Web Design

When Data Visualization Works — And When It Doesn’t – Jim Stikeleather – Harvard Business Review


“Ultimately, data visualization is about communicating an idea that will drive action. Understanding the criteria for information to provide valuable insights and the reasoning behind constructing data visualizations will help you do that with efficiency and impact”

via When Data Visualization Works — And When It Doesn’t – Jim Stikeleather – Harvard Business Review

You may also like:

7 Things You Should Know About Infographic Creation Tools – Stephen’s Lighthouse


7 Things You Should Know About Infographic Creation Tools – Stephen’s Lighthouse.

You may also like:

Information Security: The future workforce | TechRepublic


Information Security: The future workforce | TechRepublic

Updated “History of Mergers and Acquisitions in the Library Automation Industry”…03.25.13 | The Proverbial Lone Wolf Librarian’s Weblog


Updated “History of Mergers and Acquisitions in the Library Automation Industry”…03.25.13 | The Proverbial Lone Wolf Librarian’s Weblog

UPDATED | Collection of Links: BYOD


BYOD in educational institutions has been growing in popularity for years. Recently, I have seen more resources for BYOD policies in business. Below are some useful links for both.

Educational Organizations
EDUCAUSE BYOD Portal
SFU BYOD Wiki

Business
A BYOD project management primer | TechRepublic
Three BYOD policies for keeping workers (and IT) happy | TechRepublic
BYOD Security White Papers and Resources for Businesses | Webopedia
Four worst mistakes you can make with a BYOD policy | TechRepublic
10 essential elements of BYOD training | TechRepublic

How to Make Sure Your BYOD Plan Is All Good [Infographic] | Biztech

BYOD

BYOD


Major Ed-Tech Trends for 2013 – Online Colleges [Infographic]


via Major Ed-Tech Trends for 2013 – Online Colleges

Infographic: Rise of the Mobile Strategist | TechRepublic


Infographic: Rise of the Mobile Strategist | TechRepublic.

Creative Commons Infographic: Licenses Explained – Technology Enhanced Learning Blog


Helpful guide for students too!

Creative Commons Infographic: Licenses Explained – Technology Enhanced Learning Blog

Creative Commons Infographic: Licenses Explained – Technology Enhanced Learning Blog