The Most Popular Websites in the World, Country-by-Country | Gizmodo


If you’ve ever wondered what the go-to web page was around the rest of planet, wonder no longer. This map shows the most visited websites around the world, broken down country-by-country.

Most visited website per country

Read: The Most Popular Websites in the World, Country-by-Country | Gizmodo.

Infographic Shows Good News about Library Fair Use [Infographic] | ARL®


Infographic Shows Good News about Library Fair Use | Association of Research Libraries® | ARL®.

Library Fair Use

A Visual History Of The Last 20 Years Of Open Source Code | ReadWrite


We were able to visualize the percentage of total commits in a given quarter for the top 16 programming languages from 1993 until today. We hope you’ll find this image—a provocative pattern of dips and spikes—to be as interesting as we do. It truly shows how dynamic the world of programming is. We’ve also included a few graphs on other interesting data points: total number of languages by year, average lines of code per commit, and tracking which languages influenced the development of others.

Visual History Of The Last 20 Years Of Open Source Code

via A Visual History Of The Last 20 Years Of Open Source Code | ReadWrite.

Infographic: How Mobile Apps Have Changed the World | Marketing Technology Blog


Infographic: How Mobile Apps Have Changed the World | Marketing Technology Blog

Global Mobile App Stats

26% of book collections are now digital | Wiley


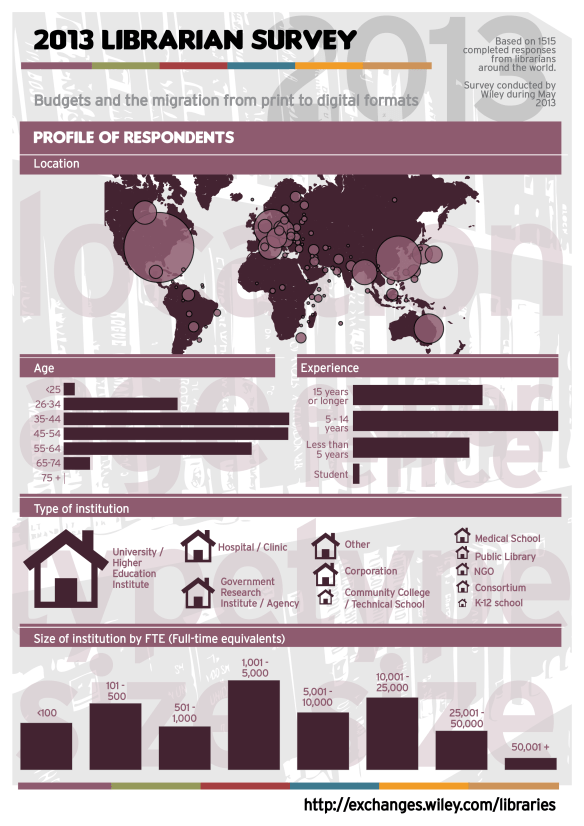
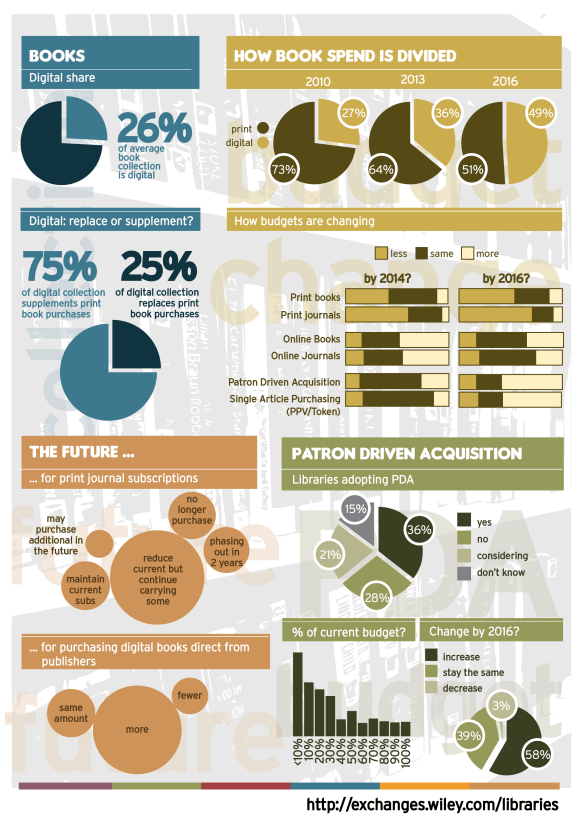
Many thanks to all of you who took part in the 2013 Librarian Survey conducted by Wiley during May.  We have produced this infographic to summarize the key results from the survey covering the areas of budgets, digital books, print vs digital journal preferences and patron driven acquisition.

There was a broad spread of responses from different territories, helped no doubt by the survey’s availability in nine languages.  37% of responses came from the Americas; 33% from countries in Europe, the Middle East and Africa; and 31% from the Asia Pacific region.  

See the end of the post for a summary of key takeaways at this link: 26% of book collections are now digital | Exchanges | Wiley.

2013 Library Survey

2013 Library Survey

Infographic: Why Buy Used Books? from ThriftBooks.com | The Digital Reader


Infographic: Why Buy Used Books? | The Digital Reader. Originally created by ThriftBooks.com.

Why Buy Used Books

Image Credit: ThriftBooks.com

Ever Been Twitter/Email/Facebook-Hacked? You’re Not Alone | Co.Exist


As of July, more people are disabling cookies, editing profiles, using encryption services, and Googling how to install those encryption services than before. But a new survey out from the Pew Research Center’s Internet Program and Carnegie Mellon University sheds light on other reasons why we might feel like our information is vulnerable: It could be because many of us have been screwed over by our bad privacy habits on the Internet already.

Ever Been Twitter/Email/Facebook-Hacked? You're Not Alone | Co.Exist | ideas + impact

The full story including more charts: Ever Been Twitter/Email/Facebook-Hacked? You’re Not Alone | Co.Exist | ideas + impact.

The Best and Worst Careers, Based on Job Outlook and Work Environment [Infographic] | LifeHacker | Cedar Education Lending


The Best and Worst Careers, Based on Job Outlook and Work Environment  [Infographic] | LifeHacker | Cedar Education Lending

Best and Worst Careers

The 10 Governments That Requested (And Got) The Most Facebook User Data | Co.Exist


74 countries sought data from Facebook for 38,000 of the network’s total 1.15 billion users.

Requests for Facebook data made from Jan to June 2013 (some requests include multiple users):

  1. United States (11,000-12,000 requests, 79% success)
  2. India (3,245 requests, 50% success)
  3. United Kingdom (1,975 requests, 68%success)
  4. Germany (1,886 requests, 37% success)
  5. Italy (1,705 requests, 53% success)
  6. France (1,574 requests, 39% success)
  7. Brazil (715 requests, 33% success)
  8. Australia (546 requests, 64% success)
  9. Spain (479 requests, 51% success)
  10. Poland (233 requests, 9% success)

The full discussion: The 10 Governments That Requested (And Got) The Most Facebook User Data | Co.Exist | ideas + impact.

Degree or disagree: Your field of study matters [Infographic] | Macleans.ca


Degree or disagree: Your field of study matters – Blog Central, Show and Tell | Macleans.ca

Story of Your Worthless Degree