
Abstract: Information technology serves as an essential tool for today’s information professional, with a need for ongoing research attention to assess the technological directions of the field over time. This paper presents the results of a survey of the technologies used by library and information science (LIS) practitioners, with attention to the combinations of technologies employed and the technology skills that practitioners wish to learn. The most common technologies employed were: email, office productivity tools, web browsers, library catalog and database searching tools, and printers, with programming topping the list of most-desired technology skill to learn. Generally similar technology usage patterns were observed for early and later-career practitioners. Findings also suggested the relative rarity of emerging technologies, such as the makerspace, in current practice.
Tag Archives: surveys
School #Librarians Want More #Tech—and Bandwidth | SLJ 2015 Tech Survey #schools #libraries
IPads, maker spaces, 3-D printers, and coding skills top the tech wish lists for 1,259 school librarians across the country, according to School Library Journal’s (SLJ) 2015 Technology Survey. Educators are hungry to bring their students even more—whether that’s robotics classes or Arduino kits.
“New computers, tablets, video equipment, all digital tools, instruction on usage, [and] enough bandwidth” count among the must-haves for Andrea Oshima, a school librarian at Aviara Oaks Elementary School in Carlsbad, CA. Currently, 64 percent of school librarians consider themselves tech leaders in their schools—and 28 percent feel that their tech skills afford them increased job security. READ MORE: School Librarians Want More Tech—and Bandwidth | SLJ 2015 Tech Survey | School Library Journal.
2014/2015 Results from the DAM Foundation Salary Survey | Dam Foundation #digitalasset
This second iteration of the DAM Foundation salary survey was conducted in 2014 in an effort to build a continuous body of linear data on the demographics, duties, and salaries of Digital Asset Managers. Results include trends in the hiring, retention, and pay of demographic groups in the developing profession of digital asset management. Building on the results of the survey conducted two years previously, the DAM Foundation continues its mission to set standards in digital asset management, and to be the premier source of information to the community of digital asset management professionals. READ MORE: 2014/2015 Results from the DAM Foundation Salary Survey | Dam Foundation
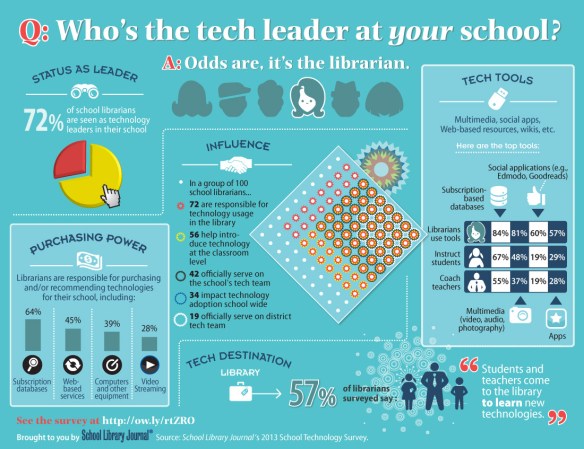
Device & Conquer: SLJ’s 2013 Tech Survey | The Digital Shift
As education technology has evolved, so, too, have the kinds of digital tools that school librarians use with their students, as shown in School Library Journal’s 2013 School Technology Survey. Handheld tablets and devices are coveted items for classroom and instructional use, along with access to online sites and apps that school librarians believe can revolutionize the way they instruct—and the way students learn. More than 750 school librarians responded to SLJ’s survey, representing K–12 public and private schools across the country. According to the data, school librarians make the most of what they have, learning one day and sharing that knowledge the next. They not only make tech tools available for students and teachers, but teach them how to use the tools as well.
Read More: Device & Conquer: SLJ’s 2013 Tech Survey | The Digital Shift.
Nice or Tough: Which Approach Engages Employees Most? | HBR
Full Post
It’s probably no news to most people who work that poor leaders produce disgruntled, unengaged employees. Our research also shows convincingly that great leaders do the opposite — that is, that they produce highly committed, engaged, and productive employees.
And the difference is cavernous — in a study of 160,576 employees working for 30,661 leaders at hundreds of companies around the world, we found average commitment scores in the bottom quarter for those unfortunate enough to work for the worst leaders (those leaders who had been rated in the bottom 10th percentile by their bosses, colleagues, and direct reports on 360 assessments of their leadership abilities). By contrast, average commitment scores for those fortunate enough to work for the best leaders (those rated in the 90th percentile) soared to the top 20th percentile. More simply put, the people working for the really bad leaders were more unhappy than three quarters of the group; the ones working for the really excellent leaders were more committed than eight out of ten of their counterparts.
What exactly fosters this engagement? During our time in the training and development industry we’ve observed two common — and very different — approaches. On the one hand are leaders we call “drivers”; on the other, those we call “enhancers.”
Drivers are very good at establishing high standards of excellence, getting people to stretch for goals that go beyond what they originally thought possible, keeping people focused on the highest priority goals and objectives, doing everything possible to achieve those goals, and continually improving.
Enhancers, by contrast, are very good at staying in touch with the issues and concerns of others, acting as role models, giving honest feedback in a helpful way, developing people, and maintaining trust.
Which approach works best? When we asked people in an informal survey which was most likely to increase engagement, the vast majority opted for the enhancer approach. In fact, most leaders we’ve coached have told us that they believe the way to increase employee commitment was to be the “nice guy or gal.”
But the numbers tell a more complicated story. In our survey, we asked the employees not only about their level of engagement but also explicitly, on a scale of one to five, to what degree they felt their leaders fit our profiles for enhances and drivers. We judged those leaders “effective” as enhancers or drivers who scored in the 75th percentile (that is, higher than three out of four of their peers) on those questions.
Putting the two sets of data together, what we found was this: Only 8.9% of employees working for leaders they judged effective at driving but not at enhancing also rated themselves in the 10% in terms of engagement. That wasn’t very surprising to many people who assume that most employees don’t respond well to pushy or demanding leaders. But those working for those they judged as effective enhancers were even less engaged (well, slightly less). Only 6.7% of those scored in the top 10% in their levels of engagement.

Essentially, our analysis suggests, that neither approach is sufficient in itself. Rather, both are needed to make real headway in increasing employee engagement. In fact, fully 68% of the employees working for leaders they rated as both effective enhancers and drivers scored in the top 10% on overall satisfaction and engagement with the organization.
Clearly, we were asking the wrong question, when we set out to determine which approach was best. Leaders need to think in terms of “and” not “or.” Leaders with highly engaged employees know how to demand a great deal from employees, but are also seen as considerate, trusting, collaborative, and great developers of people.
In our view, the lesson then is that those of you who consider yourself to be drivers should not be afraid to be the “nice guy.” And all of you aspiring nice guys should not view that as incompatable with setting demanding goals. The two approaches are like the oars of a boat. Both need to be used with equal force to maximize the engagement of direct reports.
Tablet and E-reader Ownership Update | Pew Research Center
The number of Americans ages 16 and older who own tablet computers has grown to 35%, and the share who have e-reading devices like Kindles and Nooks has grown to 24%. Overall, the number of people who have a tablet or an e-book reader among those 16 and older now stands at 43%.
Up from 25% last year, more than half of those in households earning $75,000 or more now have tablets. Up from 19% last year, 38% of those in upper-income households now have e-readers.
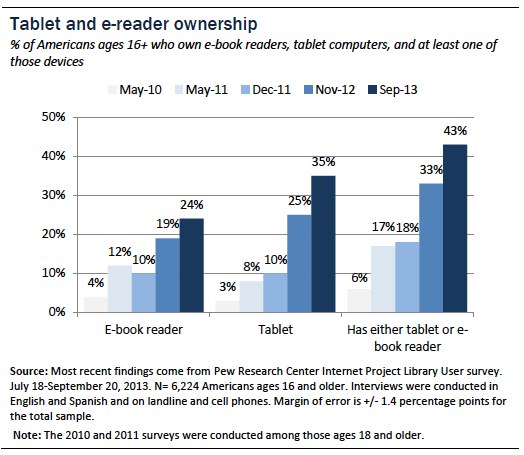
Read the full report or download the pdf.
via Tablet and E-reader Ownership Update | Pew Research Center’s Internet & American Life Project.
Skilled for Life – Key findings from the survey of adult skills | OECD Education
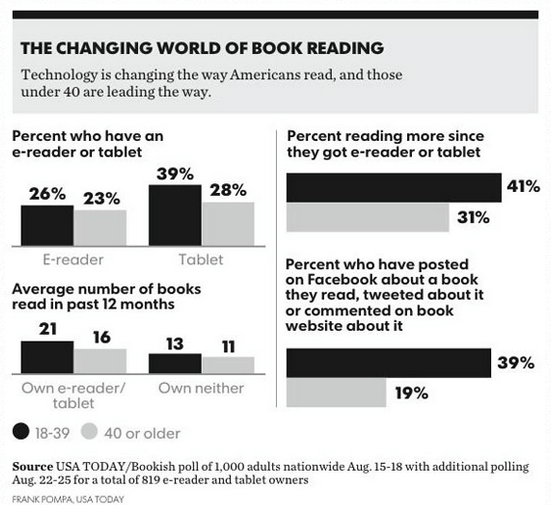
More gadgets, more reading: Survey suggests e-reader and tablet owners read more books |gigaom
A new survey from USA Today and book discovery website Bookish finds that U.S. adults who own a tablet or e-reader read more books than the device-less. The survey also found differences in reading habits between adults under 40 and adults over 40.
Read: More gadgets, more reading: Survey suggests e-reader and tablet owners read more books | gigaom
See also: E-books are changing reading habits | USA Today
300+ Followers, Quick Feedback Poll
With the blog reaching 300+ followers, I thought this would be a great opportunity for a quick feedback poll. News curation is a delicate balance. I’m sure many of you follow the same news sources I scan to repost to this blog. So when I’m scanning news items I always have in the back of my mind to post on average 5 to 10 items daily. I don’t want to spam your email inboxes, so anything over 15 posts is excessive in my mind and I try to avoid this. I overflow posts onto weekends when news becomes backlogged.
I also try to balance the types of daily posts across human interest, technology, librarianship, the MLIS and mentoring. This sometimes results in more dated news items and diversions being posted.
Here’s a quick poll asking the number of your daily post preferences. I also welcome any feedback you have, good or bad. So please leave your comments in the comment section below or email me via this contact form.
